Faster information understanding
Turn dense text, statistics and processes into a visual structure audiences can scan and understand more quickly.
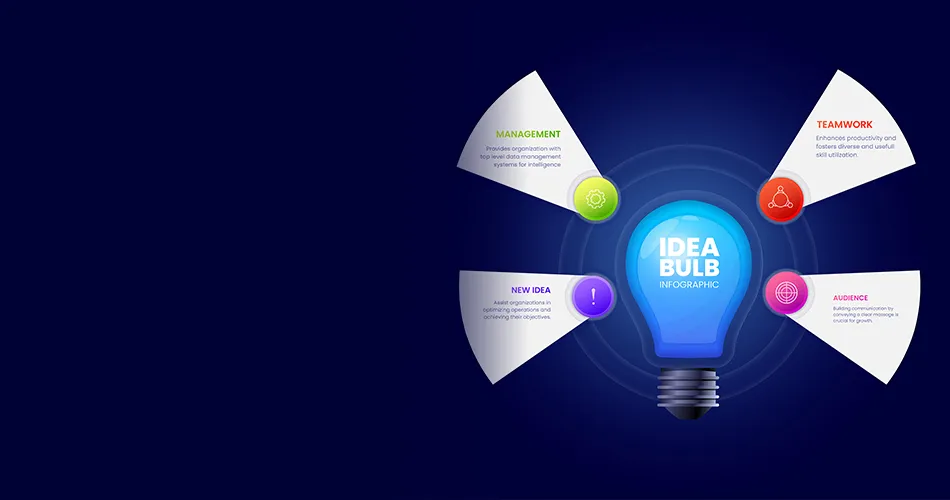
Transform complex information, data and processes into clear visual stories designed for faster understanding and stronger communication.
Enquire NowOverview
Infographic design is more than arranging icons around numbers. BrainADZ structures the message, selects the right visual model and builds a clear reading flow so data, processes and explanations become useful communication assets across marketing, sales and reporting.
Enquire Now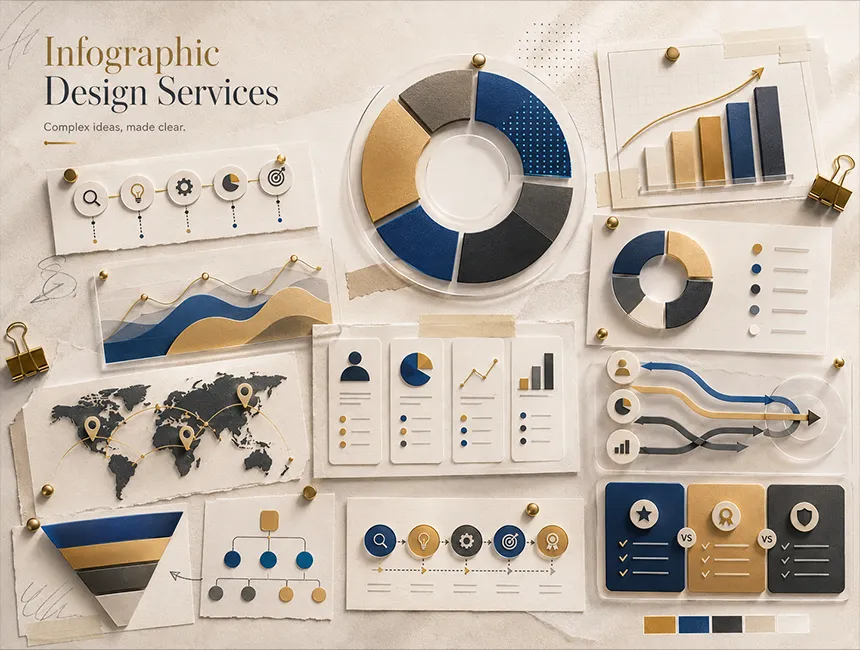
Turn dense text, statistics and processes into a visual structure audiences can scan and understand more quickly.
Guide attention from the central insight to supporting facts, comparisons and the intended next step.
Create useful visual assets that can support reports, presentations, websites, campaigns and social publishing.
Present information through a repeatable visual language aligned with your colors, typography and communication style.
Infographic Types
The format is selected according to the communication problem. A timeline, comparison, process or statistical story should not be forced into the same visual template.
Convert numbers, percentages, survey findings and performance metrics into readable visual stories.
Explain how a service, system, customer journey or operational workflow moves from one stage to another.
Help audiences evaluate options, features, approaches or before-and-after differences with less cognitive effort.
Organise history, growth, roadmaps and project milestones into a clear chronological sequence.
Break down complex subjects into accessible visual sections for awareness, training and content marketing.
Create executive-ready visuals for reports, proposals, presentations and internal communication materials.
Data Storytelling
Strong infographic design connects the content, hierarchy and visual model before styling begins. This prevents attractive graphics from weakening the actual information.
Enquire NowClarify what the audience should understand, remember or do after viewing the infographic.
Review supplied text, facts, statistics, references and brand requirements before building the visual structure.
Separate the main insight from supporting points and organise the sequence around natural reading behaviour.
Choose the right combination of charts, diagrams, icons, timelines, illustrations and text blocks for the subject.
Build a connected visual flow where every section supports the core message instead of behaving like isolated decoration.
Rework the approved design for the channels, sizes and viewing conditions included in the final scope.
Formats & Applications
Content density, proportions and typography are adapted to real viewing conditions instead of simply resizing one master file for every platform.
Create concise, mobile-friendly information graphics for feeds, carousels, stories and professional social channels.
Support landing pages, articles and resource hubs with visuals that simplify information and improve content readability.
Turn findings, strategies and performance information into executive-ready charts, diagrams and summary pages.
Prepare high-resolution information graphics for brochures, posters, exhibitions, training materials and physical displays.
Process
The workflow separates content structure from visual execution so major information problems are resolved before final design production begins.
Enquire NowWe review the objective, audience, source material, data, brand assets, required dimensions and intended use of the infographic.
The content is edited into a logical hierarchy with a clear opening insight, supporting sections and final takeaway.
We define the layout, visual metaphors, chart types, icon style, illustration approach and overall reading flow.
The approved structure is developed into a polished branded visual with balanced typography, graphics and data presentation.
Feedback is consolidated around factual accuracy, hierarchy, readability, brand alignment and visual clarity.
The master infographic is resized, quality-checked and exported in the agreed formats with organised final files.
Quality & Delivery
Final quality is evaluated at the level of information accuracy, reading behaviour, visual proportion and the technical requirements of the publishing channel.
Every number, label and statement is checked against the client-approved content and reference material.
Headline scale, spacing, contrast and grouping help audiences understand what to read first and what supports it.
Charts and diagrams are selected according to the relationship in the data rather than visual novelty alone.
Files are prepared for their real publishing environment, including digital, presentation and print requirements.
Why BrainADZ
The visual system starts with the information and audience rather than forcing every subject into the same template.
Infographics are designed to support marketing, sales, reporting, training and professional communication outcomes.
One approved visual direction can be adapted for social, websites, presentations, reports, campaigns and print.
Content, data, spelling, alignment, readability, dimensions and export settings are checked before delivery.
Selected Work
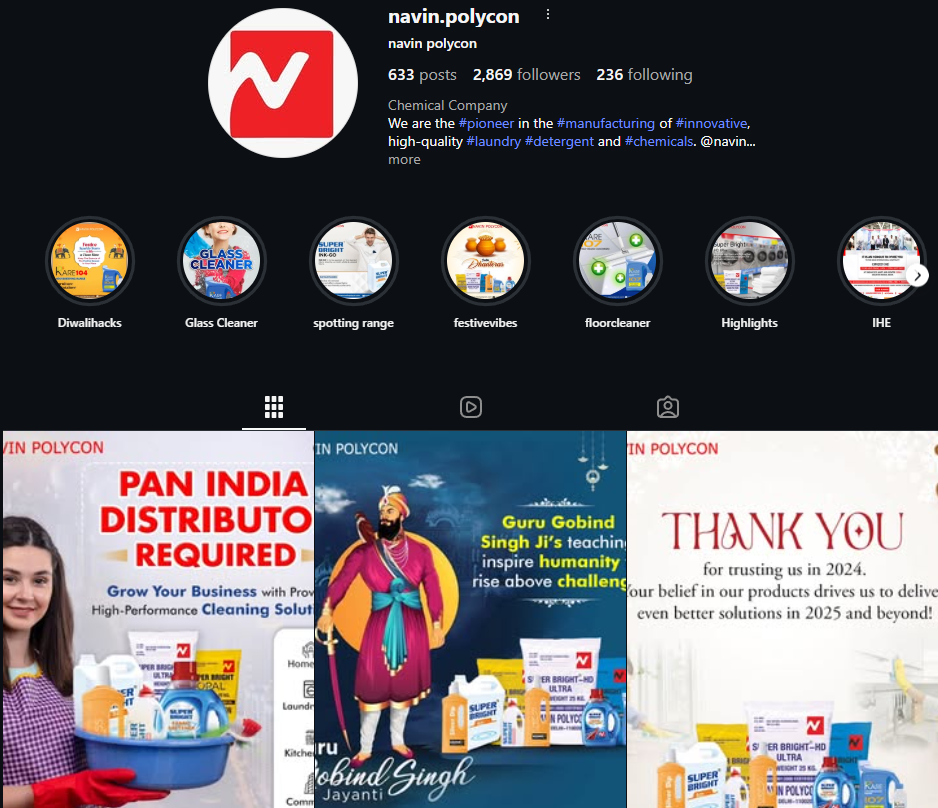
Social Content
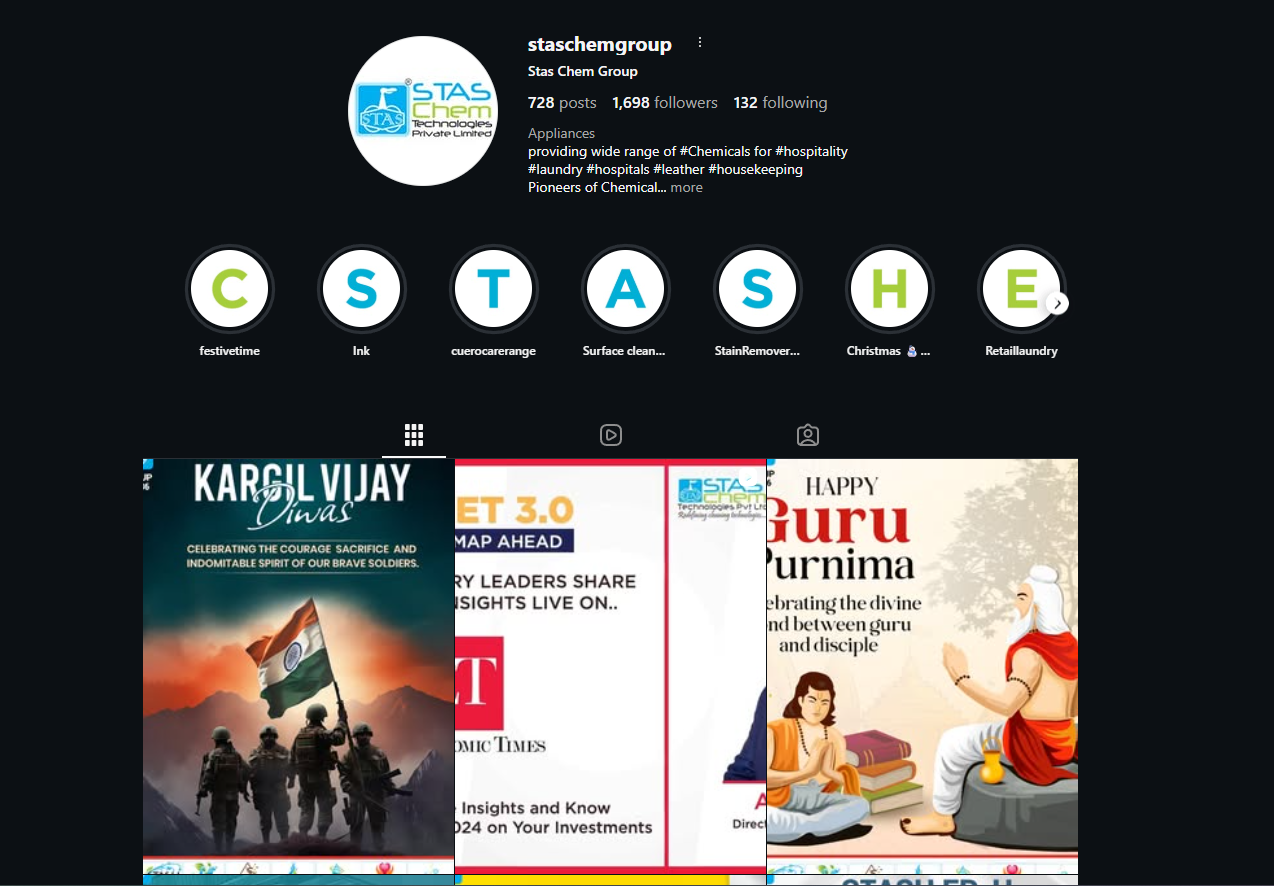
Business Communication

Corporate Design
FAQs
Practical details about content, data, formats, editable files, revisions, brand consistency and production timelines.
Enquire NowThe scope can include content review, information hierarchy, wireframing, chart and diagram selection, icon or illustration styling, branded visual design, revisions, format adaptations and final exports. The exact deliverables depend on the length, complexity and intended use of the infographic.
We can help organise, shorten and structure client-supplied content. Research and long-form copy development can also be scoped separately when required. Final statistics, claims, citations and source accuracy remain subject to client review and approval.
Yes. We can convert approved spreadsheets, reports and data tables into charts, graphs and visual summaries. The supplied data should be final, clearly labelled and accompanied by the relevant units, time periods and source notes.
Yes. We can create a master visual and then rebuild it for social posts, carousels, stories, presentation slides, web pages and print. Adaptation is planned separately because each format requires different proportions, text density and reading behaviour.
Editable files can be included when agreed in the project scope. Depending on the design, delivery may include Adobe Illustrator, Photoshop, PowerPoint or another suitable editable format along with ready-to-use PNG, JPG or PDF exports.
Yes. We use your approved logo, colours, typography, icon style and imagery rules. When formal guidelines are unavailable, we establish a practical visual direction based on your existing brand materials before developing the complete infographic.
The number of review rounds is defined in the project scope. Revisions generally cover hierarchy, wording, colours, visual treatment and approved data corrections. Major changes to the content or structure after design approval may require a revised scope.
Timelines depend on the amount of information, data readiness, chart complexity, illustration requirements, number of formats and review speed. A focused single infographic can move quickly, while research-heavy or multi-page infographic systems need a more structured schedule.

Get a clear roadmap for campaigns, creative, website, SEO, and performance before you scale your next project.